
Have you ever run a 5K race? In its simplest form, you put on running shoes, head to the start line, place one foot in front of the other, and go. At the end of the race, you check your time.
How well did you run? How much better can you get? Unless you won the race (not us!) there is no easy way to tell. You need more information combining personal performance details with the time it took to complete the race and how well others ran.
Tracking your time helps set benchmarks and determine personal bests but does little to win a race without knowing the times of everyone else.
The same is true when it comes to customer experience (CX). Built-to-last experience management programs identify the key metrics that provide the bigger picture needed for achieving well-defined business objectives. The metrics stem from finding, understanding, and applying appropriate data to make meaningful operational improvements. The metrics management process defines what success looks like by mastering the data to give teams a strategy for winning (race medal optional).
Does your customer experience metrics management approach have what it takes to win the race? Let’s find out.
What Is Metrics Management?
Customer experience metrics management is part of the XM Operating Framework. The practice involves creating a measurement system based on a combination of an organization’s experience (X) and operational (O) data. Ultimately, these metrics provide the clarity needed to drive operational priorities that enhance the customer experience and improve business performance. The process defines realistic targets for the metrics based on how they influence company outcomes.
Think of O-data as a business’s operational performance report card. This is typically the information that lets a company know how well it is doing. X-data offers insight into what people think and feel about their experiences with the company.
X- and O-data each provide valuable information. However, they may seem different and disconnected. Unfortunately, that is how many companies treat them. It is like asking how you did in the race without knowing where you placed or what times everyone else posted. Keeping them separate means you only have half the information needed to answer the question. Customer experience metrics management brings X- and O-data together, allowing you to better understand the bigger picture and maintain the right balance for allocating resources.
| (O)perational Data | E(X)perience Data |
| Daily volume of products sold | Number of customers indicating they will make a repeat purchase |
| Number of units shipped | Time to ship compared to on-time delivery expectations |
| Daily revenue earned | Customer perceived purchase value |
| Daily call center volume | Call resolution satisfaction |
Sales may be up, but so are product returns. Customers might be happy, but they are not buying again. Pairing X- and O-data places this important information side-by-side to give businesses a clear, complete picture of performance.
The continuous process involves six key steps.
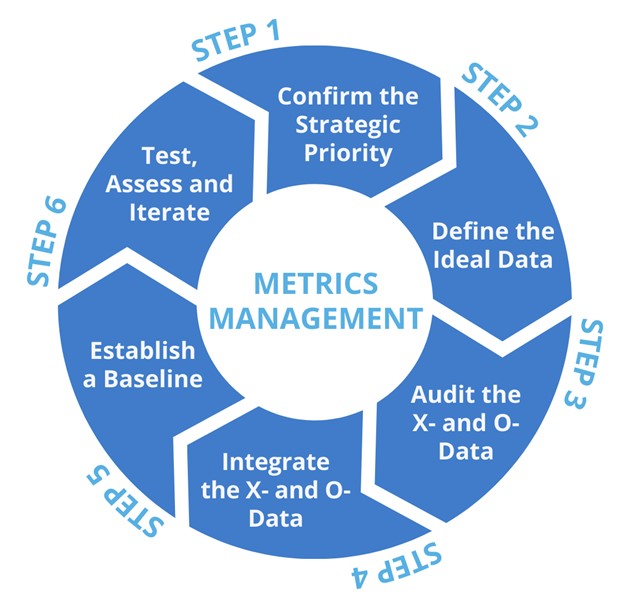
Step 1: Confirm the Strategic Priority
For a customer experience program to have a lasting positive impact, the initiative must align with the organization’s existing priorities. Therefore, the metrics management process begins by establishing the use case for a customer experience investment. Step one should answer, “What is this business trying to accomplish?” Responses might include growing top-line revenue or improving operating efficiency. On the experience side, those goals might equate to increasing customer referrals or creating self-service client options. Confirming business priorities sets the foundation and direction for improvements.
We’ll build on a common business example to show the six steps in action. To start, let’s say we want to boost operational efficiency by improving issue resolution among our support team. We believe it is taking too long for customers to get their problems fixed, causing frustration and eroding relationships.
Step 2: Define the Ideal Data
The next question is, “What data, if understood and applied properly, is relevant for our desired business outcome?” Start by identifying your theory(s) about what is happening and the hypotheses you want to test. Outline the ideal set of data required to make strategic business decisions that will improve the customer experience and create a competitive advantage.
Organizations maintain a broad universe of data which commonly creates two mistakes when it comes to metrics management:
- Analysis paralysis caused by sifting through too much of the wrong data.
- Overlooking missing data that might be key for understanding how to drive the business objective.
Going back to our example, think about what you must know for the necessary context to adjust the customer experience. If the goal is improving technical support issue resolution, then you will want to understand: When did the customer contact support? What was the issue? Did the customer feel the issue was resolved after the case was closed? How long did it take to fix things? What was the underlying root cause?
Step 3: Audit and Gather the X- and O-Data
Step three is essentially conducting an inventory to understand your starting point. What is the best data available and what gaps need filled?
Some, but likely not all, of the key data will be available. Rather than saying, “We’ll just use what we’ve got,” this step determines the critical X- and O-data needed to assess performance and make decisions. The ideal data may not currently exist, so it might mean creating new listening posts such as collecting customer feedback, conducting an employee engagement study, or obtaining customer sentiment on a public review site. You might need to start a process for filling in gaps (E.g., capturing the reason for contacting support). Also consider how to regularly update data so that it stays fresh.
Too often organizations fail to go beyond what is available. They then are surprised when the data isn’t sufficiently actionable. In our example, not having critical information about the reason for calls would prevent the support organization from identifying unresolved issue root causes.
Step 4: Integrate the X- and O-Data
Step four integrates the best available data sources and prepares the information for action. The critical question for this step is, “What is the data telling us?”
Start with the O-data and what it indicates about performance. Identify its counterparts on the X-data side that contribute to the current reality. Remember, X- and O-data work best together—separate halves of the same picture. Look for trends over time. Root cause issues the data uncovers. Aggregate data over time and across departments to create a broad view of what is happening.
Be careful not to get derailed by the data. Common barriers teams must work through include:
- Accessibility – The tendency for siloed data across functional areas is high. Because cross-functional buy-in is critical, engage with various operational stakeholders and enlist them as allies.
- Accuracy – Look for data errors and create a process to keep data updated continuously and correctly.
- Completeness – Haste makes waste, especially when it comes to data. Develop initiatives that promote 100% data field completion whenever possible.
- Continuity – X- and O-data integration is not a one-time activity. Identify and analyze data patterns over long periods of time for a more complete story of what the data is saying.
- Timing – Data audits take time. Integrating the data takes even longer. Work proactively to provide schedules, guardrails, and formats for everyone involved in creating the data sets.
Once the information is accurate and complete, translate it into something understandable and actionable.
Take into consideration how you want to look at the data. For example, O-data may provide the number of minutes it took to close the case. However, you may want to translate that into the number of days. This also is the time to fill in gaps for data not yet available.
Step 5: Establish a Baseline
Now is the time to put the data to work. Key findings should drive meaningful improvements. Step five answers the question, “What is our measuring stick for success?”
Establish a baseline from insights that combine X- and O-data. Discover which key metrics form perceptions and drive behaviors.
Define priorities and set improvement targets on the drivers best capable of making a significant impact. The metrics tracked and shared should provide the organization with a systematic way to measure the experiences provided and connect them directly to business operations.
Focus on taking action, which will look different for every group involved. Keep recommendations realistic and attainable. When it comes to successful customer experience metrics management, overall improvement outweighs the importance of attaining any single metric.
Share the metrics, and ways to improve them, throughout the company across multiple channels. Employees buy in when the information is understandable, accessible, and applicable.
This is when it starts to come together. If your transaction survey results indicate issue resolution is an issue for customers using a specific product and the operational data indicates open case aging has gotten worse, you now have your baseline (e.g., 10% of customers surveyed who use this product say their issue is not resolved and open cases average 5 days prior to resolution).
Step 6: Test, Assess and Iterate
The final step reviews the priorities in place and how well they are driving business objectives. The critical question is, “Are we achieving our desired ROI?” Assessing return on investment can be challenging. Customer experience initiatives rarely pay off all at once. The goal is incremental gains over time that benefit the customer and the company.
Experience management value planning [link to value planning article] predicts the outcomes of a CX initiative. The final step of the metrics management cycle evaluates: 1) if those predictions are becoming reality, and 2) how that is impacting broader business goals. Critical is knowing where the initiative is working well and what elements need to revisit the drawing board.
Once complete, the cycle restarts. Every business always has opportunities for improving profits and performance.
The baseline results inform priorities and action plans. In our example, a working group may come together with a target to reduce unresolved issues down to 5% for the product and open case aging by 2 days on average. Action plans are put in place and progress is monitored. The support team also compares how the volume of calls has declined since the changes were implemented, knowing that on average, there is a $15 operational cost associated with each call.
Metrics Management in Action
Let’s bring it all together and apply our six-step metrics management cycle to our issue resolution example:
A for-hire contact center wins new business by resolving client customer calls quickly and correctly. They publish their stats for the companies they currently serve in each new business proposal. Resolving calls the first time as fast as possible is a strategic priority.
The contact center recently noticed a concerning trend. What used to be an average resolution time of less than 10 minutes has crept up to 12.2 minutes. Open case aging has deteriorated. Customers are getting frustrated that resolving issues is taking too long.
A team gets to work identifying what data will reveal the issue’s root cause. They gather the necessary data and put processes in place to collect additional information that will help in the future. The integrated X- and O-data reveals three key insights:
- Lack of training on a new product is driving up open case aging because it requires more agent effort to troubleshoot issues.
- Supply chain bottlenecks are causing shipping delays that are increasing call volume.
- The contact center is currently understaffed by 11 agents. Voluntary team turnover sits at 52%, placing the remaining agents in a position to handle a greater caseload.
With an eye on what is driving the problem, the team develops targeted action plans with specific improvement goals for each group. The team assesses progress every week using X-data from an ongoing transactional survey combined with O-data to determine where success is happening and what tactics need revisited. After eight weeks of work, the average resolution time starts trending downward. At the same time, both customer and associate perceptions improve. That benefits the company’s bottom line through operational efficiencies in serving customers and lower costs tied up in training and talent acquisition.
How’s that for a gold-medal finish?
Metrics Management, Maximized
Want to maximize the value of your CX efforts? At Walker, we empower companies with customer experience support that drives decision-making. We are a Qualtrics-certified full-service Experience Management (XM) firm. Our team of experts provides end-to-end managed services and strategic consulting so you can deliver best-in-class experiences to your customers. We manage by our motto: everyone deserves an amazing experience.